
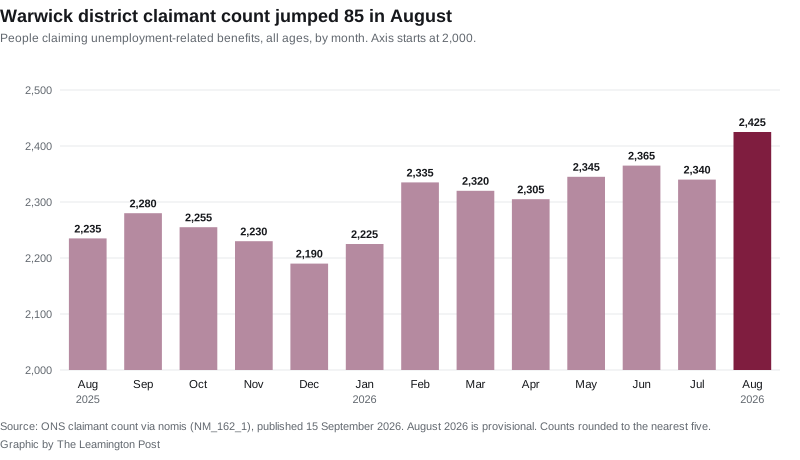
2,425 people in Warwick district claimed jobless benefits in August, up 85 in a month and the most since December 2021. Under-25 claims are up 22% in a year.
2,425 people in Warwick district were claiming unemployment-related benefits in August. That is 85 more than in July, and the highest monthly count since December 2021.
The rise is concentrated among young people again. There were 495 claimants aged 18 to 24, up 90 on August last year. That is a rise of 22.2%, more than double the UK’s 10.0%.
The figures are the ONS claimant count for August 2026, published on 15 September and taken from nomis.
The key numbers
- 2,425 claimants in Warwick district, 2.5% of residents aged 16 to 64
- Up 85 in a month (3.6%), against a 2.3% monthly rise across the UK
- Up 190 in a year (8.5%), against 2.1% across the UK
- Highest monthly count since December 2021, when it was 2,430
- 495 claimants aged 18 to 24, the most since July 2021
An August rise is not the usual pattern
Summer does not normally push the district’s count up like this. Here is how it moved between July and August in each of the last five years:
| Year | July | August | Change |
|---|---|---|---|
| 2022 | 2,095 | 2,085 | -10 |
| 2023 | 2,020 | 1,935 | -85 |
| 2024 | 2,260 | 2,255 | -5 |
| 2025 | 2,220 | 2,235 | +15 |
| 2026 | 2,340 | 2,425 | +85 |
In three of the previous four years the count fell over the month. This year it rose by the most of the five.
Young claimants keep climbing
The 18 to 24 count has not fallen in any month since March. It went from 425 in March to 495 in August, and from 405 a year ago.
| Age | August 2025 | August 2026 | Change |
|---|---|---|---|
| 18 to 24 | 405 | 495 | +90 |
| 25 to 29 | 245 | 270 | +25 |
| 30 to 34 | 245 | 250 | +5 |
| 35 to 39 | 290 | 295 | +5 |
| 40 to 44 | 290 | 270 | -20 |
| 45 to 49 | 205 | 235 | +30 |
| 50 to 54 | 205 | 195 | -10 |
| 55 to 59 | 165 | 200 | +35 |
| 60 to 64 | 150 | 165 | +15 |
Nearly half the district’s rise over the year, 90 of 190, is among 18 to 24 year olds. We reported the same pattern for July, when young people also drove about half the increase. The only age bands to fall over the year are the early forties and the early fifties.
How Warwick district compares with the rest of Warwickshire
Every district in the county rose faster than the UK over the year.
| District | August 2025 | August 2026 | Change |
|---|---|---|---|
| North Warwickshire | 1,035 | 1,205 | +16.4% |
| Stratford-on-Avon | 1,640 | 1,870 | +14.0% |
| Rugby | 2,065 | 2,245 | +8.7% |
| Warwick | 2,235 | 2,425 | +8.5% |
| Nuneaton and Bedworth | 3,600 | 3,695 | +2.6% |
| Warwickshire | 10,575 | 11,435 | +8.1% |
| United Kingdom | 1,663,580 | 1,698,450 | +2.1% |
Warwick district’s rate of 2.5% is still below the county’s 3.0%, the West Midlands’ 5.3% and the UK’s 3.9%. It is the direction of travel that stands out, not the level.
Where claimants live
Rates across the district’s 17 wards run from 3.8% down to 1.4%. The highest are all in Leamington and Warwick:
- Leamington Brunswick: 3.8% (295 claimants)
- Leamington Clarendon: 3.3% (260)
- Warwick All Saints and Woodloes: 3.3% (190)
- Warwick Aylesford: 3.1% (140)
- Leamington Lillington: 2.8% (200)
The lowest are Cubbington and Leek Wootton at 1.4%, Kenilworth Abbey and Arden at 1.5% and Kenilworth St John’s at 1.6%.
Leamington Brunswick was also the highest-rate ward in July, at 3.6%. Ward counts are rounded to the nearest five, so a small ward change can be rounding rather than a real move.
July’s figure has been revised down
When we reported July last month, nomis gave the district count as 2,395. It now gives 2,340, a downward revision of 55. The July under-25 figure moved from 480 to 475.
The ONS says the latest month is provisional and subject to revision, and that recent revisions have tended to go downwards. So August’s 2,425 may also come down when September’s figures are published. Even a revision of the same size would leave August, at 2,370, above every other month this year.
What it means for you
The claimant count is not the unemployment rate. It counts people on Jobseeker’s Allowance, plus people on Universal Credit who must look for work to keep the benefit. Some of them are working limited hours. Some unemployed people are not counted at all because they do not claim. The ONS says plainly that the measure does not attempt to measure unemployment.
What the figures do show is that more people in Leamington, Warwick and Kenilworth are being asked by the benefits system to look for work than at any point since December 2021. The steepest rise is among those aged 18 to 24.
Two things worth knowing:
- If you run a local group that helps households with living costs, Warwick District Council’s Cost-of-Living Fund offers not-for-profit organisations, including school PTAs, grants of up to £3,000. The deadline is Wednesday 30 September 2026.
- Ward-level figures for your own area are free to look up on nomis, updated monthly.
Sources
- ONS claimant count, via nomis, dataset “Claimant count by sex and age” (NM_162_1), for every figure quoted: the Warwick district monthly counts from July 2021 to August 2026, the rate as a share of residents aged 16 to 64, the age breakdown for August 2025 and August 2026, the five Warwickshire districts, Warwickshire, the West Midlands and the UK, and the 17 ward counts and rates for August 2026. Counts are rounded to the nearest five.
- Labour market overview, UK: September 2026, Office for National Statistics, for the 15 September 2026 release date and the statement that the latest month’s claimant count is provisional, with recent revisions tending downwards.
- Council relaunches Cost of Living fund, Warwick District Council, 2 September 2026, for the grant size, who can apply and the 30 September deadline.
- Claimant count methodology, Office for National Statistics, for what the measure includes and why it is not the unemployment rate.
Have your say