
The average Warwick district home reached £372,922 in June, up £16,808 in a year and the fastest rise in Warwickshire. It is still £684 below February's level.
The average home in Warwick district sold for £372,922 in June, £16,808 more than a year earlier. That is a rise of 4.7%, the steepest in Warwickshire and more than two and a half times the England figure of 1.8%.
The numbers come from the UK House Price Index, which HM Land Registry builds from completed sales rather than asking prices. June 2026 is the most recent month published. The district covers Royal Leamington Spa, Warwick, Kenilworth, Whitnash and the villages between them.
One caveat before the rest: the UKHPI average is a mean, not a median. A handful of large sales pull it upward, so it sits above what a typical buyer pays.
The rise mostly happened a year ago
The annual figure is real, but it flatters the last few months. The district average has barely moved since the winter.
- June 2024: £345,576
- June 2025: £356,114
- February 2026: £373,606
- June 2026: £372,922
June’s figure is £684 below where the district stood in February. The whole of the £16,808 gain was banked between last summer and this winter. Since then the market here has been flat.
How the district compares
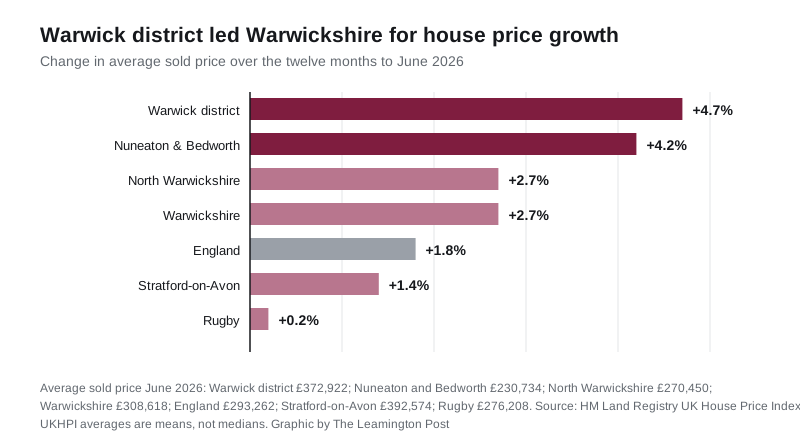
Warwick district was the fastest riser of Warwickshire’s five districts and boroughs over the twelve months to June 2026.
| Area | Average price, June 2026 | Annual change |
|---|---|---|
| Warwick district | £372,922 | +4.7% |
| Nuneaton and Bedworth | £230,734 | +4.2% |
| North Warwickshire | £270,450 | +2.7% |
| Stratford-on-Avon | £392,574 | +1.4% |
| Rugby | £276,208 | +0.2% |
| Warwickshire | £308,618 | +2.7% |
| England | £293,262 | +1.8% |
The ranking flips depending on which question you ask. Warwick district is growing fastest, but Stratford-on-Avon is still the county’s most expensive place to buy, at £392,574. The gap between them has narrowed to £19,652, from £30,896 a year ago.
Rugby is the outlier at the other end. Its average rose by £440 across the whole year, from £275,768 to £276,208.
Semis and terraces are pulling the average up
The growth has not been even across property types. Flats have been left behind.
| Property type | Average price, June 2026 | Annual change |
|---|---|---|
| Detached | £659,518 | +4.3% |
| Semi-detached | £392,262 | +5.7% |
| Terraced | £326,045 | +5.6% |
| Flat or maisonette | £216,948 | +2.7% |
Semi-detached homes rose fastest, up £21,197 to £392,262. Terraced homes went up £17,208. Flats added £5,698, roughly a quarter of the semi-detached gain in cash terms.
That matters for anyone selling a flat in central Leamington to trade up to a semi in Whitnash or Warwick. The step between the two has grown, not shrunk.
First-time buyers
The average first-time buyer in Warwick district paid £306,446 in June, up 5.0% on the £291,946 of a year earlier. That is £14,500 more, and the fastest rise of the buyer groups the index tracks here.
Buyers using a mortgage paid £381,232 on average, up 4.9%. Cash buyers paid £349,920, up 4.3%.
What it means for you
If you are selling, the annual headline is better than the recent trend. Anyone pricing off “up 4.7% in a year” is pricing off a rise that finished in February. The index has moved sideways since, and June still sits below where February stood.
If you are buying, the flat spell is the useful bit. The district average has moved less than £700 since February, so there is no obvious cost to taking another month over a decision.
If you are a first-time buyer, your part of the market is moving faster than the market as a whole, not slower. The 5.0% first-time buyer rise beat the 4.7% district figure.
If you are watching the wider picture, the district is now £79,660 above England’s average, having been £68,000 above it a year ago.
A monthly index is not a valuation. Sales volumes for recent months are still incomplete, and the Land Registry revises figures as more completions are registered, so June’s number will move slightly. For the longer view of what Leamington, Warwick and Kenilworth homes actually sell for, see our Leamington house prices page.
Update, 21 September 2026: HM Land Registry has since revised the June 2026 average for Warwick district down from the £372,922 reported here to £369,417, a cut of £3,505, and the annual change from 4.7 to 3.7 per cent. The figures above are what the index held at the time of writing. The current position is in our July 2026 report.
Have your say